Maverick Protocol has brought a breath of fresh air to the AMM DEX market thanks to improved liquidity supply mechanisms, thereby bringing about much better capital efficiency. However, nothing is perfect and neither are these new mechanisms. Join Weakhand to learn about Maverick Protocol’s weaknesses in providing liquidity.
To better understand Maverick Protocol, people can refer to the following articles:
- What is Maverick Protocol (MAV)? Overview of Cryptocurrency Maverick Protocol
- Maverick Wars Is Just a Thing Sooner or Late
- Maverick Wars And Price Increase For MAV
Overview of Maverick Protocol
Maverick Protocol is an AMM DEX platform with many improvements compared to traditional protocols such as Uniswap v2 or Uniswap v3. Maverick brings a new definition to liquidity provisioning called Directional LPing, allowing users to better provision and optimize their liquidity through pre-defined strategies.
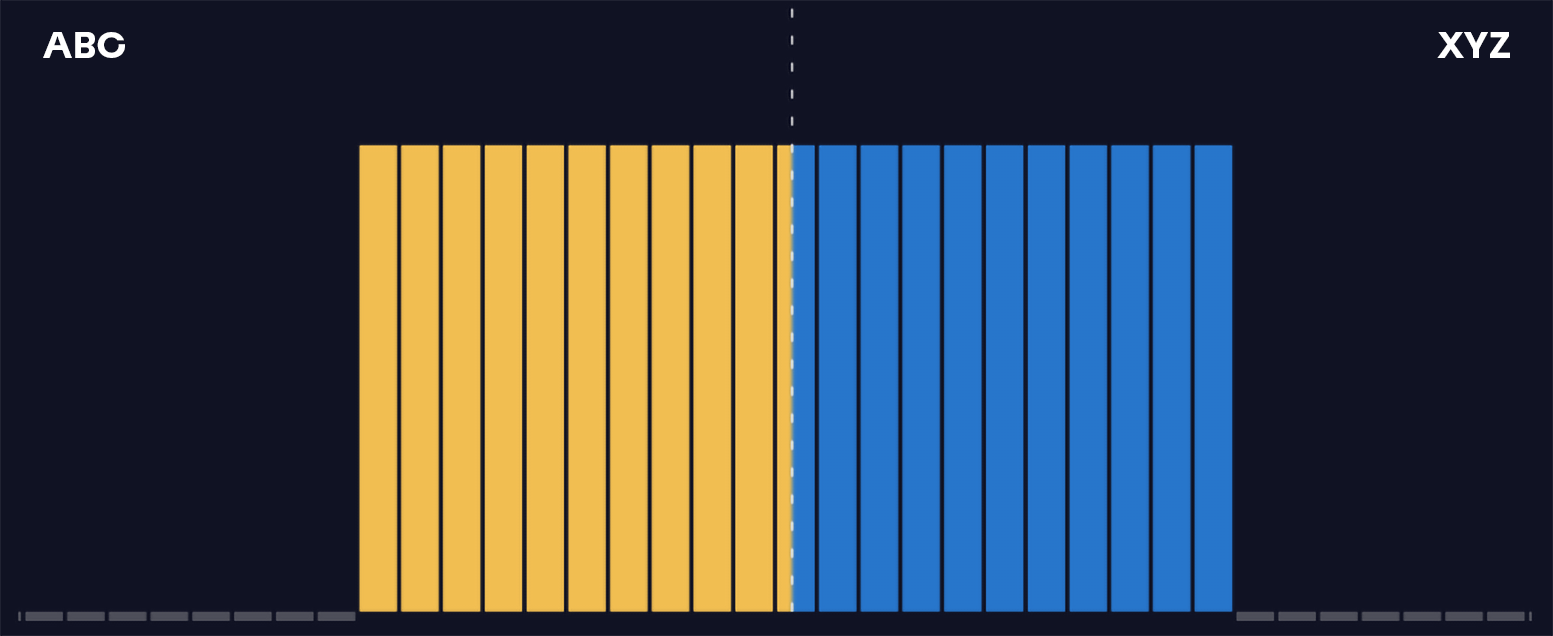
Each given price range of any liquidity pair on Maverick Protocol will be specified as 1 Bin, making it easier for users to use. Usually for volatile assets, Bin will be set at 2% and 0.05% for stablecoins, however, each person can still customize it larger or smaller depending on personal strategy.
Mechanism of Operation of Maverick Protocol
The operating mechanism of Maverick Protocol will be divided into 4 different modes including:
- Mode Static.
- Mode Right.
- Mode Left.
- Mode Both.
Mode Static

This is the most basic mode and quite similar to AMM platforms where the price Bins will not move when the price goes beyond the liquidity supply zone. Mode Static will be divided into 3 different types to help people choose:
- Exponential: Liquidity is most concentrated at the selected price level and gradually decreases exponentially in the left and right Bins.
- Flat: Liquidity is evenly distributed across selected Bins.
- Single Bin: Liquidity distributed to a single Bin.
Exponential and Flat will be quite similar to AMM with other centralized liquidity mechanisms, the most different of Mode Static to other platforms is probably Single Bin when liquidity is distributed in a single Bin.
Mode Right

This mode will default to Single Bin and allows users to provide liquidity at a certain price Bin initially. If the token price decreases, the price Bin will still be there, but if the price increases beyond the Bin, it will also move to the right.
This strategy will be very suitable for those who predict that the price of the token for which they provide liquidity will continue to grow in the future. In addition, this strategy is also quite suitable for Liquid Staking Tokens such as rETH, cbETH, swETH,… as their prices will gradually increase over time compared to ETH.
Mode Left
In contrast to Mode Right, users will also be provided with liquidity at a certain Single Bin, however, the price Bin will not move when the price increases but only moves to the left when the price decreases from the initial liquidity provision level. .
In complete contrast to Mode Right, Mode Left will be very suitable for predicting and providing liquidity in a bearish market.
Mode Both

It can be said that Mode Both is a combination of Mode Right and Mode Left when allowing users to provide liquidity at a Single Bin. When the price increases, the Price Bin will automatically move to the right to keep up with the price, conversely when the price decreases, the Price Bin will also automatically move to the left.
Mode Both is very suitable for providing liquidity in a sideways market or for those who do not have the ability to accurately predict future price increases or decreases. This is also the most suitable mode for stablecoins when the price fluctuations of this type of product are usually not too large.
In addition, we also have a condition for Bins to move in all 3 modes: the price must be at least 2 Bins different from the original liquidity providing Bin. To make it easier to understand, if you provide ARB liquidity in Both mode and each Bin has a value of 2%, the price of ARB needs to increase or decrease by at least 2% compared to the initial zone for the Bin to actually move.
Some Impressive Numbers of Maverick Protocol

Thanks to new mechanisms that provide a high degree of customization for liquidity providers, Maverick Protocol has achieved some impressive numbers, the most notable being its daily trading volume. is stable in the top 5 DEXs according to Defillama statistics.
If we calculate the ratio of transaction volume to TVL of Marvelick Protocol, the number will be 2.98. If compared to the leading large AMM DEX platforms in the DeFi market, this number is completely superior. :
- Uniswap: 0.2
- PancakeSwap: 0.15
- Curve Finance: 0.056
To explain why Maverick Protocol’s Volume/TVL ratio is so large, the simplest answer is probably that the protocol has helped users optimize capital efficiency to the highest level. thereby reducing price slippage as well as other problems when trading.

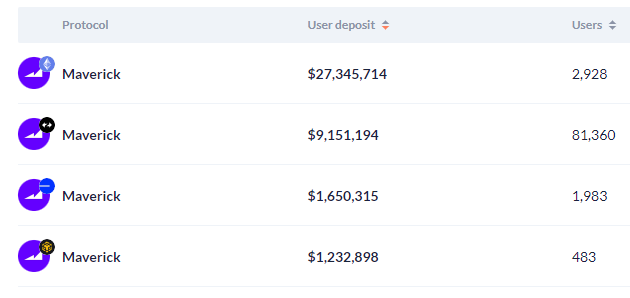
After just over half a year of mainnet and deployment on 4 different blockchains, Maverick Protocol has attracted more than 86,000 users to provide liquidity on its platform. The majority of the user base and liquidity provision is on the zkSync Era network, however the majority of TVL is on Ethereum.
Maverick Protocol’s Weakness in Providing Liquidity
The biggest difference of Maverick Protocol is probably also the weakness of this protocol when it allows liquidity bins to be moved. To better understand why that is a weakness, we will go into an example below.
Peter proceeds to provide $100 liquidity for the ETH-USDC pair, assuming the ETH price at that time is $3.5 and we have the following price ranges:
- Region A: $1-2
- Region B: $2-3
- Region C: $3-4
- Region D: $4-5
- Zone E: $5-6
The ratio between ETH and USDC at the price of $3.5 will be balanced and zone C will be where liquidity is provided corresponding to the $3-4 price Bin, then Peter will have a position consisting of 50 USDC-14.28 ETH ( means buying 14.28 ETH at $3.5). The mode that Peter chooses is Mode Both, so when the price increases or decreases, the price Bin also changes in the same direction.
In addition, we also need to understand when the price leaves the Bin, how the tokens in the pool will fluctuate before going into a deeper example:
- When the price drops from Bin -> USDC will be automatically transferred to ETH.
- When the price increases from Bin -> ETH will be automatically transferred to the entire USDC store.
Let’s look at the example where the price drops and then rises back to its original level:
- The price leaves zone C and returns to zone B -> all USDC is automatically converted into ETH at a price of $3 -> the remaining position is 0 USDC – 30.95 ETH, the average ETH purchase price is $3.23 per token.
- The price continues to leave area B and return to area A -> The liquidity bin containing 0 USDC – 30.95 ETH will automatically move to area C to area B -> The bin will lose its effect temporarily because it is outside the liquidity area.
- The price begins to recover from area A to area B -> The liquidity bin will be traded again and the amount of ETH and USDC will gradually be balanced again (which means gradually converting ETH to USDC).
- The price increases from zone B to zone C -> The liquidity bin will now automatically convert all ETH to USDC -> meaning selling ETH at an average price of $2.5 and this Bin will also lose its effectiveness temporarily – > The user’s position will now be 77.38 USDC-0 ETH.
To summarize the above case, Maverick automatically bought ETH at an average price of $3.23 when the market dropped then sold them all back at $2.5 when the market rebounded, causing a loss of $22.62 for Peter. We can also see a similar thing in reverse when the price of ETH increases as Maverick will automatically sell all tokens at a low price then buy them at a high price.
In this example, the price percentage of each Bin has also been exaggerated many times so that we can see the loss more intuitively, in fact the price bins are set at an average level from 0.5-2%. However, it is possible for the Crypto market to fluctuate strongly like the above example in a day, including BTC or ETH.
Unlike Impermanent Loss or temporary loss, which is one of the things that a liquidity provider always focuses on, losses like the example above are called Permanent Loss or permanent loss by the Maverick team. Calculating Permanent Loss is much more difficult as it not only follows the usual x*y=k formula but also depends on many other factors.
From the above example we can also see that Maverick is not really an attractive land for providing liquidity for assets other than stablecoins. This lack of compatibility will cause Maverick Protocol to lose points in the eyes of Liquidity Providers because:
- Provide liquidity according to Mode Static mechanism: There is no obvious difference with other AMMs and the actual trading volume is also lower, so the fees received are lower, leading to small profits despite better capital efficiency.
- Providing liquidity by Volatility Bin mechanisms: A large Permanent Loss results in the actual profit received being lower than the loss.
Summary
Although it has brought a breath of fresh air to the AMM DEX market with its new and unique liquidity provision mechanism, not every model is perfect and neither is Maverick Protocol when the mechanism Directional LPing is only really suitable for stablecoins.
Above is Maverick Protocol’s weakness in providing liquidity. Weakhand hopes that through this article, it will be able to help people be more prepared before participating in making profits on this platform.


